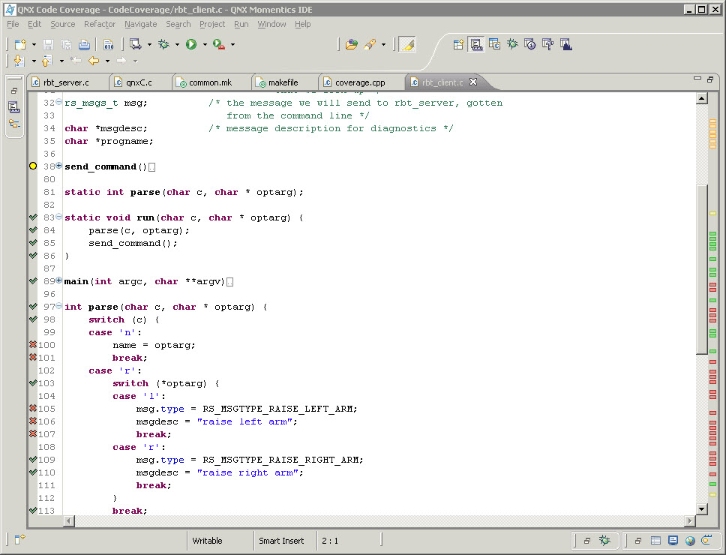
The IDE can show the line-by-line coverage information for your source code. In the Figure below, the left margin of the editor shows a summary of the coverage (whereas the right margin shows color-coded bars), by showing green check marks for fully covered code, a red cross for each line not covered, and a yellow ball icon for each partially covered or a block of collapsed code.

Code Coverage Editor view
Opening a file in the Code Coverage perspective
To open a file in the QNX Code Coverage perspective:
- In the Code Coverage Sessions view, expand a session and double-click a file or function.
Code coverage markers are added to the left pane of the opened file.
Showing coverage information for a specific session
To show coverage information from a particular session:
- In the Code Coverage Sessions view, select a session. The IDE shows all of the various markers.
Showing coverage information when opening a file
To automatically show coverage information when opening a file:
- Open the Preferences dialog ().
- In the left pane, select .
- In the right pane, check the desired markers in the Coverage markup when file is opened field.
- Click OK. The next time you open a file, the markers appear automatically. To add markers from another session, add them manually, as described above.
Removing coverage markers
To remove all coverage markers:
- In the Code Coverage Sessions view's title bar, click the Remove All Coverage Markers button (
 ).
).