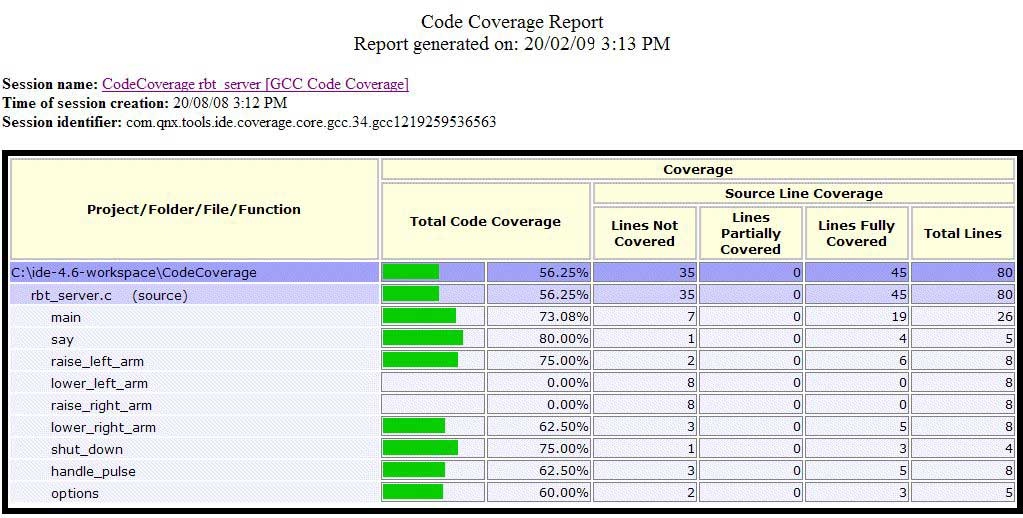
The Code Coverage Report view provides a summary (in XML) of your session. The view lets you drill down into your project and see the coverage for individual files and functions:

Code Coverage Report view summary.
Generating a report
To generate a report, simply right-click a coverage session and select Generate Report.
By default, the IDE shows reports in the Code Coverage Report view, but you can also have the IDE show reports in an external browser. Using an external browser lets you compare several reports simultaneously.
Changing views
To toggle between viewing reports in the Code Coverage Report view and in an external browser:
- Open the Preferences dialog ().
- In the left pane, select .
- In the right pane, enable or disable the Use external Web browser check box.
- Click OK.
Saving a report
To save a report:
- Right-click in the Code Coverage Report view to show the context menu.
- Click Save As... to save the report.
Refreshing a report
To refresh a report:
- In the Code Coverage Report view's title bar, click the
Refresh button (
 ).
).
Printing a report
To print a report:
- In the Code Coverage Report view's title bar, click the Print
button (
 ).
).
Setting report options
By default, the report generated by the IDE doesn't include the code coverage information from other included files; however, you can choose to view this information, if desired.
- Select .
- In the left pane, expand QNX and select Code Coverage.
- In the right pane, select Show code coverage information from included files.
- Click OK.