The import of memory analysis data is useful in two cases. If it isn't possible to start a Memory Analysis session using the
IDE, for example, when there is no network connection between a target and host machine, or if qconn isn't running on the target machine, you can start memory analysis on the target (see Launching from the command line with Memory Analysis enabled), and then transfer the data file to your host to perform a postmortem memory analysis. If you want to share a session, you
can export it in XML format, and then later it can be imported to view the data. Compared to a trace file, the XML format
is self-contained and doesn't require binaries and libraries to be present at import time.
To import a memory analysis trace file:
-
Click .
-
Select , and then click Next.
-
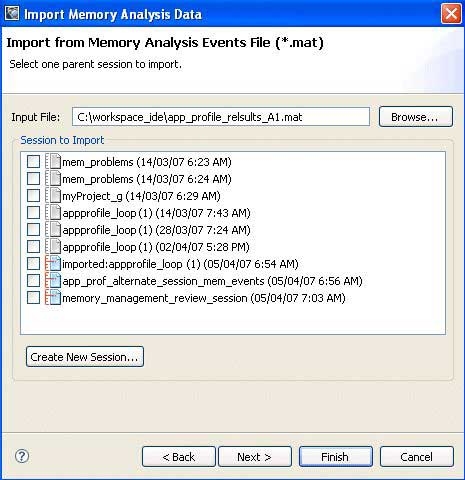
For the Input File field, click Browse to select an input file.

-
Choose a session from the Session to import list, or click Create New Session to create a new session to import data into.
You can select only one session for the import process.
-
Click Next.

-
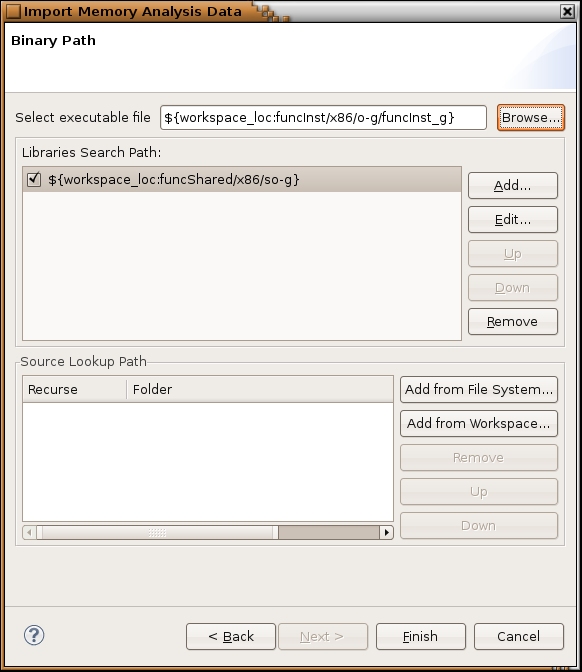
On this page, you can select an executable for the application. Click From Workspace or From File System to select an executable file.
Although this step is optional, you should select a binary for the application; otherwise, reported events won't have a connection
to the source code, and traces won't have navigation data.
The executable you select should be exactly the same as the one running on the target machine.
-
Optional: Add locations for the source folders. This step is required only if you intend to navigate to the editor from the
memory analysis tables. Click Add from File System or Add From Workspace to add a source lookup path to the list.
-
Click Finish, to begin importing.
When the importing process completes, you can open the Memory Analysis session to view the results.

