To run leak a detection application and all user specific shared libraries, it should be compiled with debug information,
and the target should have librcheck.so library installed.
To enable leak detection, from the IDE:
-
From an existing launch configuration, select the Tools tab.
-
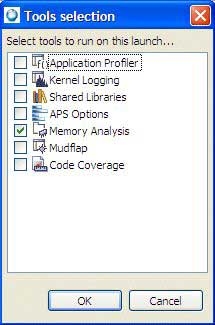
Select Add/Delete Tool.
-
Select Memory Analysis and click OK.

-
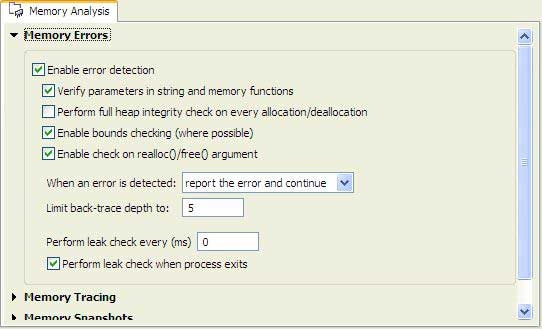
On the Memory Analysis tab, expand Memory Errors.
-
The easiest way to detect leaks is to specify a time interval for leak detection. For example, if you want to enable leak
detection every minute, enter 60000 (for 60 seconds) in the Perform leak check every (ms) field.

-
On the Memory Analysis tab, expand Memory Traces and ensure that tracing is enabled. If tracing isn't enabled, leaks would be detected, but wouldn't carry out the allocation
backtrace, which makes it almost impossible to identify.
-
Select the Perform leak check when process exits option if your application exists normally.
-
Select the Switch to this tool's perspective on launch' option.
-
After enabling Memory Analysis in a launch configuration, run that configuration.
There are a few other ways to enable memory analysis, including attaching to a running application or postmortem analysis.
For more information about these and other launch options, see Launching your program with Memory Analysis.

