The Show Threads Tree option lets you show a graphical representation of the threads and calling functions within your application. You can drill down to see the detail of the lowest function calls.
To access this tree:
- From the toolbar menu in the Execution Time view, click the Show Threads Tree icon.
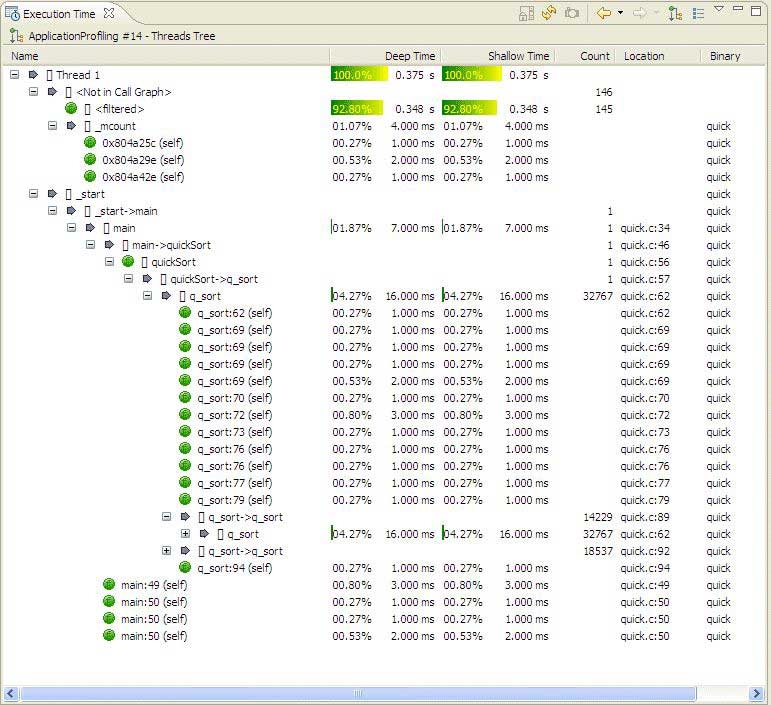
The Show Threads Tree view.
You can use this information to:
- identify which threads are the most and least active
- determine the appropriate size of your application's thread pool. (If there are idle threads, you might want to reduce the size of the pool.)
To view quantitative profiling values:
- In the annotated source editor, let the pointer hover over a colored bar. The CPU usage appears, and shows as percentage and time values.