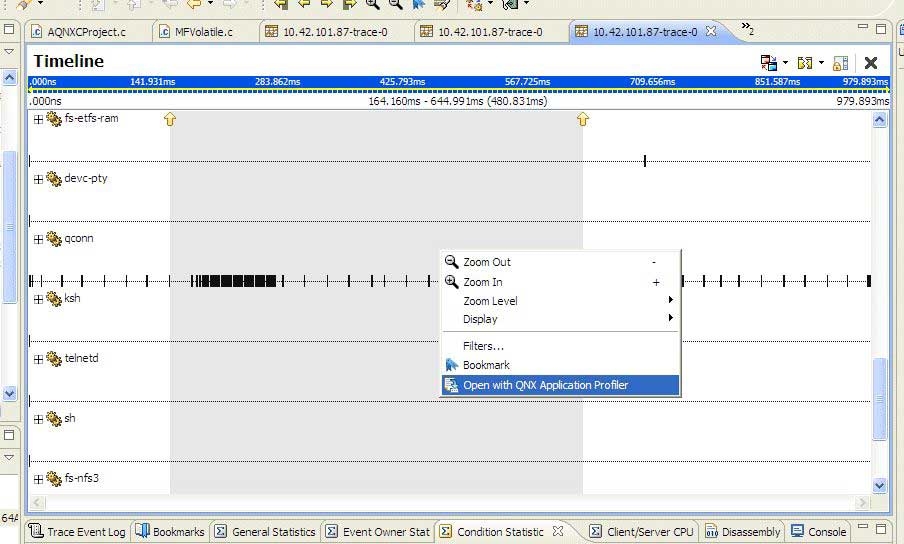
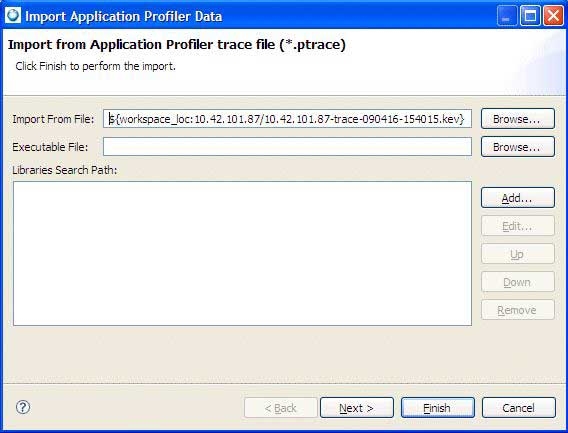
The IDE lets you import only a portion of a kernel trace into Application Profiler; however, you can also continue to import
the entire kernel trace, if required. When you use the import action from the System Profiler editor, only the portion of
the kernel trace that is currently selected will be imported into the Application Profiler. This means that the Application
Profiler only considers a single process from the trace; it chooses the process that is associated with the binary selected
by the user.
To import a selected portion of the kernel trace into Application Profiler:

