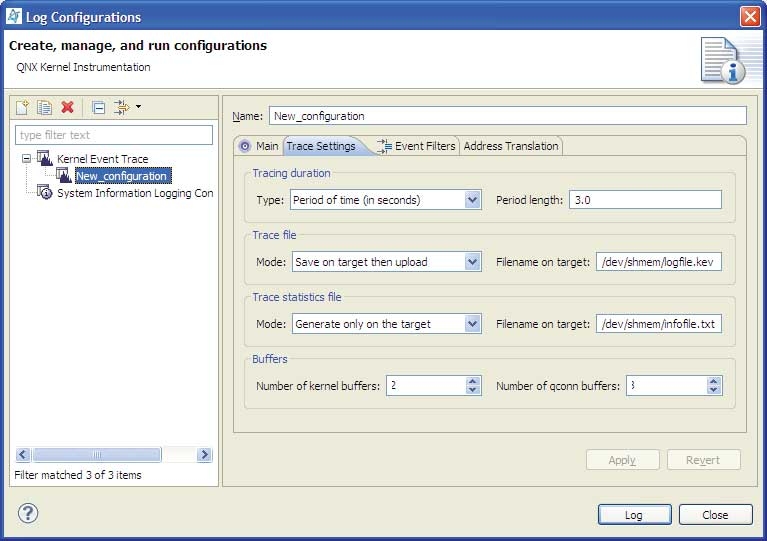
The Log Configuration dialog takes you through the process of selecting:
- the location of the captured log file (both on the target temporarily and on the host in your workspace)
- the duration of the event capture
- the size of the kernel buffers
- the number of qconn buffers
- the event-capture filters (to control which events are captured)

Capturing event-specific information using kernel logging.
Here are the main fields in this wizard:
- Tracing method Type (Period of time)
- The duration of the capture of events as defined by a period of time. This is the default.
- Tracing method, Period length
- A floating-point value in seconds representing the length of time to capture kernel events on the target.
- Tracing method, Type (Iterations)
- The duration of the capture of events as defined by the number of kernel event buffers.
- Tracing method, Number of Iterations
- Total number of full kernel event buffers to log on the target.
- Trace file, Mode (Save on target then upload)
- In this mode, kernel event buffers are first saved in a file on the target, then uploaded to your workspace. This is the default.
- Trace file, Filename on target
- Name of the file used to save the kernel event buffers on the target.
- Trace file, Mode (Stream)
- In this mode, no file is saved on the target. Kernel event buffers are directly sent from qconn to the IDE.
- Trace statistics file, Mode (Generate only on the target)
- The information file is generated only on the target. This is the default.
- Trace statistics file, Mode (Do not generate)
- No file is generated.
Note: If your target is running earlier versions of QNX Neutrino, you must use this option instead of Generate only on the target because the trace statistics file is not supported on versions such as QNX Neutrino 6.2.1.
- Trace statistics file, Mode (Save on target then upload)
- The statistical information is first saved in a file on the target, then uploaded to your workspace.
- Trace statistics file, Filename on target
- Name of the file used to save the statistical information on the target.
- Buffers, Number of kernel buffers
- Size of the static ring of buffers allocated in the kernel.
- Buffers, Number of qconn buffers
- Maximum size of the dynamic ring of buffers allocated in the qconn target agent.