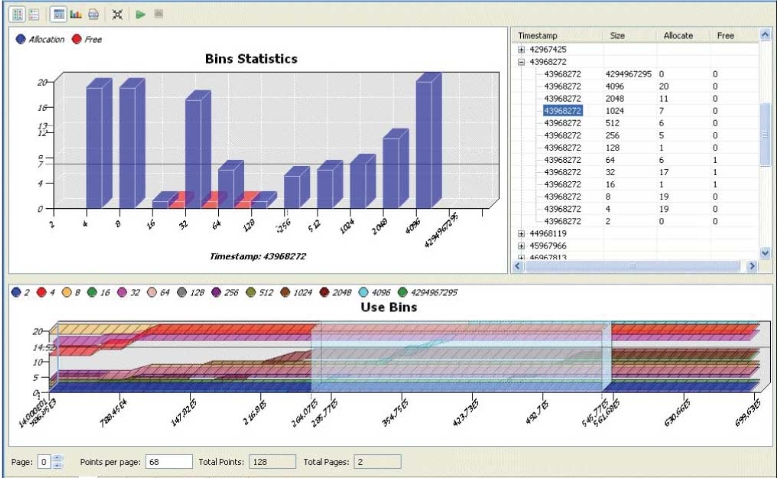
The allocator keeps counters for allocations of various sizes to help gather statistics about how your application is using memory. Blocks up to each power of two (2, 4, 8, 16, etc. up to 4096) and large blocks (anything over 4 KB) are tracked by these counters.
The Bins tab shows the values for these counters over time:

The counters are listed at the top of the Bins tab. Click the circle to the left of each counter to enable or disable the counter in the current view.
When the Bins tab is shown, the Chart pane shows allocations and deallocations for each bin at the time selected in the Details pane. The Details pane lists the memory events for the selected region of the Bins tab.
-

- Play the selected range of the Use Bins; the Bins Statistics chart shows the usage dynamically.
-

- Stop.
Because of the logging that's done for each allocation and deallocation, tracing can be slow, and it may change the timing of the application. You might want to do a first pass with the bins snapshots enabled to determine the hot spots or ranges, and on the second pass reduce the tracing to a certain range (minimum, maximum) to filter and reduce the log set.